In almost every task or resource view, indicators have their own column on the left side of the screen — it’s the only one that has a picture 
-
Right-click the column heading to the right of where you want to put the Indicators column.
-
Click Insert Column, and then click Indicators.
Tip: If you’re not sure what an indicator means, rest the pointer over it. A box pops up to explain it.
For a more technical look at indicators, including a list of them, see Indicators fields.
Change or get rid of indicators
Don’t forget that indicators only show status; they don’t control it. In fact, you can’t change the indicators in the Indicators column directly.
If an indicator doesn’t seem right, look for the underlying cause. For example, if the complete indicator 
If you’d rather not see the indicators at all, you can hide the column: Right-click the column heading and then click Hide Column.
Create custom indicators
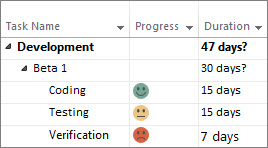
When you add custom fields to your project, you can pick indicators for different values in those fields. For example, you could make a progress field with different images for tasks that are on track, behind schedule, and blocked.
To create a custom field:
-
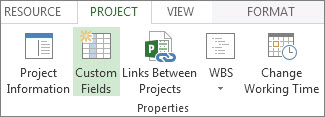
Click Project > Custom Fields.
-
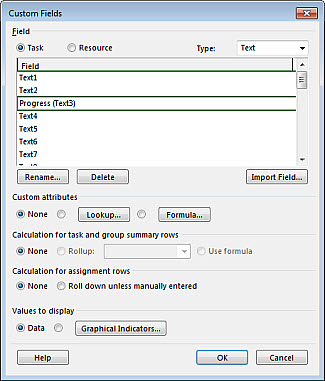
Choose an unused text field, and then click Rename.
-
Type Progress (or whatever name you want) and click OK.
-
Under Custom attributes, click Lookup.
-
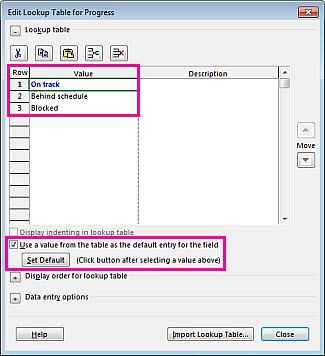
In the table, add the values you want. For our example, type On track, Behind schedule, and Blocked.
-
Select the Use a value from the table as the default entry for the field check box.
-
Click the first value (On track), clickSet Default, and then click Close.
To choose the indicators:
-
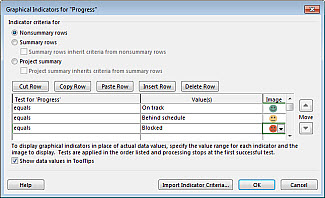
Back in the Custom Fields dialog box, under Values to display, click Graphical Indicators.
-
In the Test for ‘Progress’ column, pick equals.
-
In the Value(s) column, add the value name you set earlier (On track, Behind schedule, and Blocked).
-
In the Image column, add a picture for each value. This will be the indicator that shows up in your project plan. (If the cute smiley faces in the image below aren’t your thing, there are plenty of other choices!)
-
Click OK twice to go back to the Gantt Chart.
To add the custom field to the Gantt Chart:
-
Right-click the column heading to the right of where you want to put the custom Progress column.
-
Click Insert Column, and then pick Progress from the list.
-
Pick a progress status for each task.