
Perhaps you’ve come across a Business Intelligence (BI) Center site and you don’t know what it’s for. Or, maybe you’re looking for that perfect place to store and share reports with people in your organization. Whether you’re an administrator, report author, or information consumer, a BI Center site can be a valuable resource. It’s not just a place to store files; it’s also a way to bring together information and processes using a variety of BI tools.
A BI Center site is a SharePoint site that was designed especially for BI content, such as data connections, reports, scorecards, and dashboards. A BI Center site has certain characteristics that set it apart from other kinds of SharePoint sites. These include prebuilt lists and libraries designed especially for BI content, access to PerformancePoint Services content (for on-premises customers), sample files, and links to helpful information about BI tools.
Prebuilt lists and libraries for BI content
A BI Center site includes a set of SharePoint lists and libraries that make it easy to organize and use BI content. Lots of lists and libraries come with a BI Center site. The most commonly used libraries are the Dashboards library, Data Connections library, Documents library, and Pages library.
|
This list or library... |
Does this... |
And this is useful to these people... |
|
Dashboards library |
The Dashboards library contains dashboards that have been created. A dashboard is essentially a collection of related reports hosted in a single location, such as a SharePoint site. A sales dashboard might include a scorecard showing sales amounts compared to target values alongside reports showing sales across different product categories and sales channels. Most dashboards contain one or more reports and filters that people can use to focus on more specific information. Dashboards that were created by using SharePoint Web Part pages or PerformancePoint Dashboard Designer are store in the Dashboards library by default. |
Site administrators Dashboard authors Dashboard consumers looking for a specific dashboard |
|
Data Connections library |
The Data Connections library contains connections to external data sources that people can use to create reports, scorecards, and dashboards. Administrators can create and manage data connections in this library. This can save a lot of time and trouble because people have easy access to the data they need without having to hunt down server names and work account. Administrators can make sure people have access to the right data, and report authors can focus on creating the reports that are needed instead of first spending time creating or re-creating connections to data sources. |
Database administrators Report and dashboard authors |
|
Documents library |
Virtually all SharePoint sites come with a documents library, and the BI Center site is no exception. In a BI Center site, the Documents library typically contains Excel workbooks and reports, such as SQL Server Reporting Services reports, PerformancePoint reports and scorecards, Visio diagrams, and so on. You can put other kinds of files there, too, such as Word documents, PowerPoint presentations, and so on. |
Report authors Information consumers |
|
Pages library |
As the name suggests, the Pages library contains a list of pages that were created in a BI Center site. When a BI Center site is first created, you’ll see just a few pages listed, such as the default and excelservicessample pages. As people add pages to the site, you’ll see them listed here in the Pages library. You’ll also be able to see whether a page has been checked out, and when it was last modified, and by whom. |
Administrators Report and dashboard authors Information consumers |
PerformancePoint Services content
PerformancePoint Services enables you to create and use powerful reports, scorecards, and dashboards. If your organization is using SharePoint Server 2013 (on premises), you’ll have a link to the PerformancePoint Content page in the BI Center site. Initially, you can only access PerformancePoint Dashboard Designer—the tool you’ll use to create PerformancePoint content—from this page.
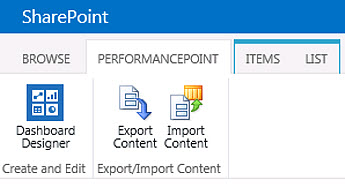
Once Dashboard Designer is installed on your computer, you’ll be able to open it from your Start menu or from the PerformancePoint Content page in the BI Center site. Just make sure that an administrator has configured PerformancePoint Services before you attempt to open and use Dashboard Designer.
Sample files
Many people are unfamiliar with BI tools and applications. If you’re new to BI in SharePoint, a couple of sample items are available so that you can see and try some of the new capabilities in Office and SharePoint. There’s an Excel Services Sample workbook in the Documents library that contains a variety of charts, tables, and slicers.
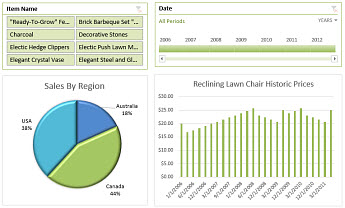
An example Excel Services dashboard is available in the Documents library
There’s also a sample dashboard called excelservicessample in the Pages library. It contains the same content as the sample workbook, displayed on a page so you can see how it looks and works in a browser window.
Links to more information
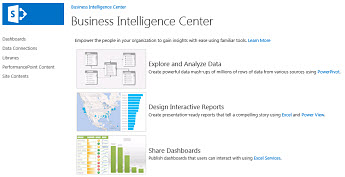
The BI Center site has lots of links to additional information. For example, if you don’t know anything about PowerPivot, one of the BI tools available from Microsoft, you can choose the PowerPivot hyperlink to view Help content and other information about that. Similarly, if you’re interested in Power View, a BI tool that you can use to create mashups in Excel, you can choose the Power View hyperlink to view information about it.
A BI Center site has links to Help and other information about BI tools and applications
Next steps
Chances are, your organization uses a variety of applications to create reports, scorecards, and dashboards. You can use a BI Center site to store, manage, share, and view those reports. See the following resources for more information.
-
If you’re an administrator and you want to set up a BI Center site, see Create a Business Intelligence Center site.
-
If you’re a report author or information consumer and you have a BI Center site available, see Use a Business Intelligence Center site.


