
Note: This article has done its job, and will be retiring soon. To prevent "Page not found" woes, we're removing links we know about. If you've created links to this page, please remove them, and together we'll keep the web connected.
Important: Get Office 365 Project Portfolio Dashboard for iPad in the Apple App Store!
Office 365 Project Portfolio Dashboard is an app that you can use in conjunction with Project Online to quickly view and drill down into charts that illustrate things like progress, cost, schedule, and resources.
First, connect Office 365 Project Portfolio Dashboard to Project Online. When you first launch the app, you'll be asked to enter your Project Online URL, your user name, and your password.
Six dashboards are included by default:
-
This Year's Projects
-
Last Year's Projects
-
Next Year's Projects
-
Major Active Initiatives
-
My Active Projects
-
All Projects
Tip: If your administrator has added Office 365 Project Portfolio Dashboard to your Project Online site, you can create your own dashboards on the web, which are then available for viewing in Office 365 Project Portfolio Dashboard for iPad.
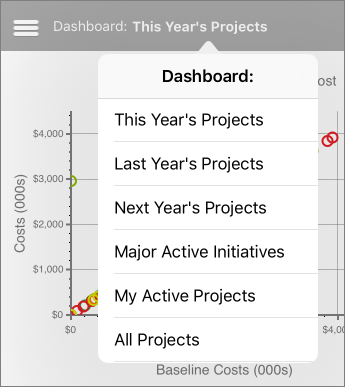
How do I switch between dashboards?
Tap the current dashboard name to see a list of available dashboards, and then choose another one from the list.
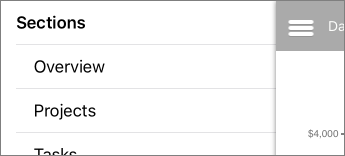
Each dashboard has different sections
Tap the menu button (three lines) at the top left to switch between sections.
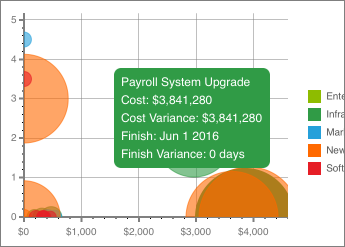
Drill down for more detail
In some places, more information is displayed right on the chart. In other spots, another page is shown to drill into greater detail. To drill down, try selecting an area or row of a chart or table.
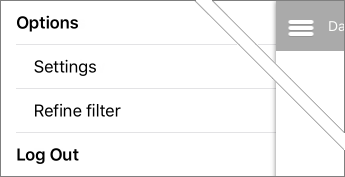
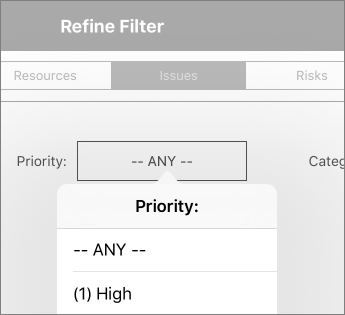
Use filters to refine what you're seeing
Tap the menu button (three lines) at the top left, and then choose Refine filter.
Tap the filter category across the top, and then use the lists to choose which filters to apply. Tap Save at the top right when you're done.
Tip: You can also filter information in some charts by tapping different items in the legend.


