
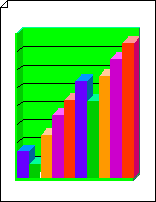
The ruled background and three-dimensional look of the 3-D charting shapes emphasize the differences among items you're comparing and help make the bar chart more visually interesting.
Create a 3-D bar graph
-
Start Visio.
-
In the Business category, click Charts and Graphs or Marketing Charts and Diagrams.
-
From Charting Shapes, drag a 3-D axis shape onto the drawing page. Drag a selection handle to resize the shape as needed.
-
Drag a 3-D bar graph shape on top of the 3-D axis. Choose the number of bars you want (up to five bars—you can add more later), the highest point in the value range, and the value and color of each bar, and then click OK.
-
Align the lower left corner of the bar graph shape with the lower left corner of the axis shape.
Tip: To zoom in, hold down CTRL+SHIFT and click the graph.
-
To add a title, from Charting Shapes, drag a Text block shape onto the drawing page. With the text block selected, type a title.
Change the number of bars
-
Right-click the 3-D bar graph, and then click Bar count and range.
-
Select the number of bars you want, and then click OK.
Tip: If you want to create a 3-D bar graph that has more than five bars, use a second 3-D bar graph shape and line up the second shape with the first.
Change bar values and colors
-
Right-click the 3-D bar graph, and then click Bar properties.
-
Type values and select colors for the bars you want, and then click OK.
Note: Bar values are relative to the range for the entire bar graph. To set the range, right-click the 3-D bar graph, and then click Bar count and range. Type the range you want, and then click OK.
Set the width and height of the bars
-
Click the 3-D bar graph to select it.
-
Drag the control handle at the bottom right corner of the first bar, until the bars are the width you want.
-
Drag the selection handle at the top of the graph until the bars are the height you want.
Add value and name labels
-
From Charting Shapes, drag the Y-axis label shape onto the drawing page. Line it up at the x- and y-axis origin, so that its horizontal line is flush with the x-axis.
Tip: To zoom in, hold down CTRL+SHIFT and click the graph.
-
With the Y-axis label shape selected, press CTRL+D to create a copy. Position the second label toward the top of the y-axis, so that its horizontal line is flush with the highest value.
Tip: To nudge a shape into position, select the shape and then press the arrow key that represents the direction you want.
-
Repeat to create labels for additional values along the y-axis.
-
Select each label shape, and then type the value or name that corresponds to the shape's position on the axis.
-
Repeat steps 2 through 4 using X-axis label shapes, and positioning them along the x-axis.
Recolor and label each axis
-
Click the 3-D axis shape to select it.
-
On the Home tab, in the Shape Styles group, click Fill, and then select the color you want.
-
Click one of the default labels to subselect it, and then type a new label.
-
To move a label to another location, place the pointer over the label's control handle


