
To aggregate (sum) values in a PivotTable, you can use summary functions like Sum, Count, and Average.
The Sum function is used by default for numeric value fields you place in your PivotTable, but here’s how to choose a different summary function:
-
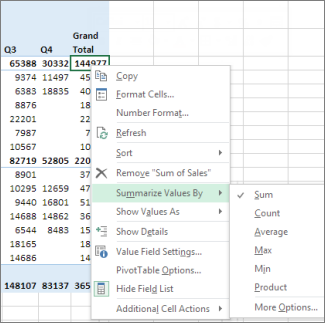
In the PivotTable, right-click the value field you want to change, and then click Summarize Values By.
-
Click the summary function you want.
Note: Summary functions aren’t available in PivotTables that are based on Online Analytical Processing (OLAP) source data.
Use this summary function:
To calculate :
Sum
The sum of the values. It’s used by default for value fields that have numeric values. If your field contains blanks or nonnumeric (text, date, or Boolean) values when you place it in the Values area of the Field List, the PivotTable uses the Count function for the field.
After you've placed the field in the Values area, you can change the summary function to Sum, and any blank or nonnumeric values are changed to 0 in the PivotTable so they can be summed.
Count
The number of nonempty values. The Count summary function works the same as the COUNTA function. Count is used by default for value fields that have nonnumeric values or blanks.
Average
The average of the values.
Max
The largest value.
Min
The smallest value.
Product
The product of the values.
StDev
An estimate of the standard deviation of a population, where the sample is a subset of the entire population.
StDevp
The standard deviation of a population, where the population is all of the data to be summarized.
Var
An estimate of the variance of a population, where the sample is a subset of the entire population.
Varp
The variance of a population, where the population is all of the data to be summarized.
Distinct Count
The number of unique values. This summary function only works when you use the Data Model in Excel.
Need more help?
You can always ask an expert in the Excel Tech Community or get support in Communities.


