Sign in with Microsoft
Sign in or create an account.
Hello,
Select a different account.
You have multiple accounts
Choose the account you want to sign in with.

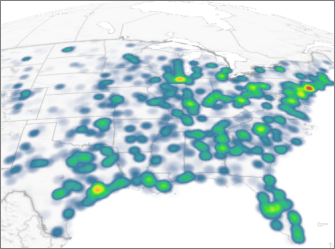
When you open 3D Maps, Bing Maps automatically plots your data in a column chart. You can change to a heat map, where colors represent your data, making it easy for people to take in lots of data at a quick glance.

Heat map of the middle and eastern US showing energy capacity
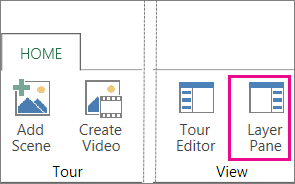
  1. Click Home >Layer Pane.

    Layer Pane button on the Power Map Home tab

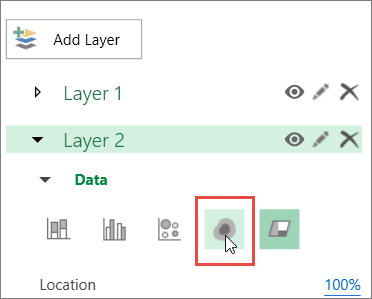
  2. In the Layer Pane, in the layer that you want to display as a heat map, click the Heat Map icon.

    Heat Map icon in Layer Pane

    Notes: 

    • When you switch to a heat map, the Height field changes to Value.

    • You may want to zoom in or rotate the chart to get a better view of the heat map.

    • You can’t add annotations to heat maps.

Need more help?

Want more options?

Explore subscription benefits, browse training courses, learn how to secure your device, and more.

Communities help you ask and answer questions, give feedback, and hear from experts with rich knowledge.

Was this information helpful?

What affected your experience?
By pressing submit, your feedback will be used to improve Microsoft products and services. Your IT admin will be able to collect this data. Privacy Statement.

Thank you for your feedback!

×