
If you want to illustrate the reporting relationships in your company or organization, you can create a SmartArt graphic that uses an organization chart layout, such as Organization Chart.
Tip: An alternative way to draw an org chart is with Visio, the Microsoft diagramming app. If you have Visio, read about how to use it to make an org chart in Create an organization chart in Visio.
Overview of creating an organization chart
Use a SmartArt graphic to create an organization chart in Excel, Outlook, PowerPoint, or Word to show the reporting relationships in an organization, such as department managers and non-management employees.

If you're unfamiliar with using SmartArt graphics, you might want to read the following articles before getting started on an organization chart:
Create an organization chart
-
On the Insert tab, in the Illustrations group, click SmartArt.
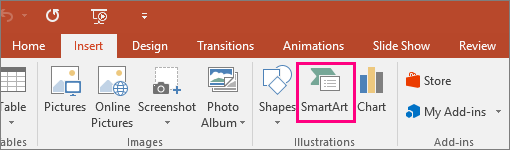
Example of the Illustrations group on the Insert tab in PowerPoint 2016 -
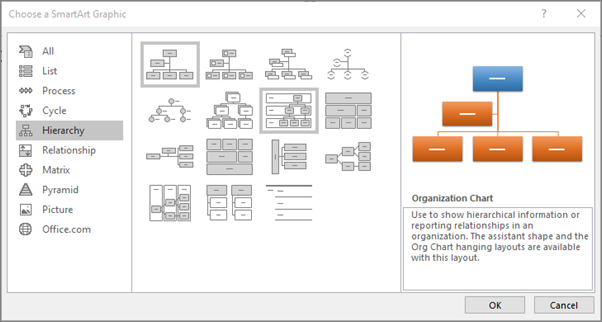
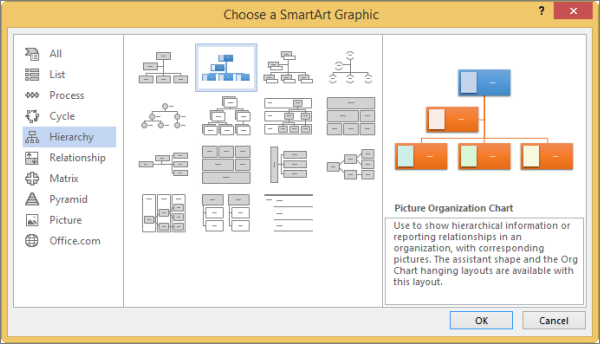
In the Choose a SmartArt Graphic gallery, click Hierarchy, click an organization chart layout (such as Organization Chart), and then click OK.
-
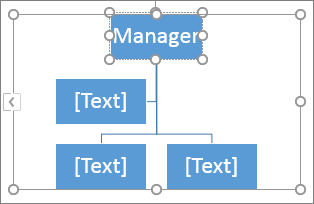
To enter your text, do one of the following:
-
Click in a box in the SmartArt graphic, and then type your text.
Note: For best results, use this option after you add all of the boxes that you want.
-
Click [Text] in the Text pane, and then type your text.

-
Copy text from another location or program, click [Text] in the Text pane, and then paste your text.
Notes:
-
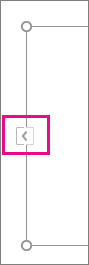
If the Text pane is not visible, click the control on the edge of the SmartArt graphic.
-
-
-
What else would you like to do?
Important: This feature is not available in Outlook or in Office 2007.
-
In your document, presentation, or spreadsheet, on the Insert tab, in the Illustrations group, click SmartArt.
Example of the Illustrations group on the Insert tab in PowerPoint 2016 -
In the Choose a SmartArt Graphic gallery, click Hierarchy, click Picture Organization Chart or Circle Picture Hierarchy, and then click OK.
-
To add a picture, in the box where you want to add the picture, click the picture icon, locate the folder that contains the picture that you want to use, click the picture file, and then click Insert.
-
To enter your text, follow the instructions in step 3 of Create an organization chart.
Add a box
-
Click the existing box that is located closest to where you want to add the new box.
-
Under SmartArt Tools, on the Design tab, in the Create Graphic group, click the arrow next to Add Shape, and then do one of the following:

Note: If you do not see the SmartArt Tools or Design tabs, make sure that you have selected the SmartArt graphic. You may have to double-click the SmartArt graphic to select it and open the Design tab.
-
To insert a box at the same level as the selected box but following it, click Add Shape After.
-
To insert a box at the same level as the selected box but before it, click Add Shape Before.
-
To insert a box one level above the selected box, click Add Shape Above.
The new box takes the position of the selected box, and the selected box and all the boxes directly below it are each demoted one level.
-
To insert a box one level below the selected box, click Add Shape Below.
-
To add an assistant box, click Add Assistant.
The assistant box is added above the other boxes at the same level in the SmartArt graphic, but it is displayed in the Text pane after the other boxes at the same level.
Add Assistant is available only for organization chart layouts. It is not available for hierarchy layouts, such as Hierarchy.
-
Delete a box
To delete a box, click the border of the box you want to delete, and then press Delete.
Notes:
-
When you need to add a box to your relationship graphic, experiment with adding the shape before or after the selected shape to get the placement you want for the new shape.
-
To add a shape from the Text pane:
-
At the shape level, place your cursor at the end of the text where you want to add a new shape.
-
Press Enter, and then type the text that you want in your new shape.
-
To add an assistant box, press Enter while an assistant box is selected in the Text pane.
-
-
Although you cannot automatically connect two top-level boxes with a line in the organization chart layouts, such as Organization Chart, you can imitate this look by adding a box to the top level to your SmartArt graphic and then drawing a line to connect the boxes. (On the Insert tab, in the Illustrations group, select Shape, select a line, and then draw a line between the two boxes.) Learn more about drawing lines by reading Draw or delete a line or connector.
-
To move a box, click the box that you want to move and then drag the box to its new location. To move or "nudge" the box in very small increments, hold down Ctrl while you press the arrow keys on your keyboard.
To show a dotted-line reporting relationship between two boxes, change the style of the line between the two boxes.
-
Click the SmartArt graphic whose line you want to change.
-
Right-click the line, and then click Format Shape on the shortcut menu.
-
Click Line or Line Style, and then click the Dash type that you want.
A hanging layout affects the layout of all boxes below the selected box. Although you can use other hierarchy layouts to create an organization chart, hanging layouts are available only with organization chart layouts.
-
Click the box in the organization chart that you want to apply a hanging layout to.
-
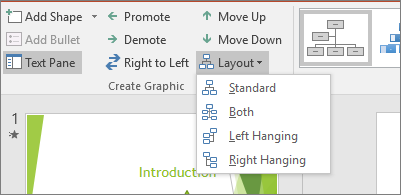
Under SmartArt Tools, on the Design tab, in the Create Graphic group, click Layout, and then do one of the following:
Note: If you do not see the SmartArt Tools or Design tabs, make sure that you have selected a SmartArt graphic. You may have to double-click the SmartArt graphic to select it and open the Design tab.
-
To center all of the boxes below the selected box, click Standard.
-
To center the selected box above the boxes below it and arrange the boxes below it horizontally with two boxes in each row, click Both.
-
To arrange the selected box to the right of the boxes below it and left-align the boxes below it vertically, click Left Hanging.
-
To arrange the selected box to the left of the boxes below it and right-align the boxes below it vertically, click Right Hanging.
-
You can apply color combinations that are derived from the theme colors to the boxes in your SmartArt graphic.
-
Click the SmartArt graphic whose color you want to change.
-
Under SmartArt Tools, on the Design tab, in the SmartArt Styles group, click Change Colors.
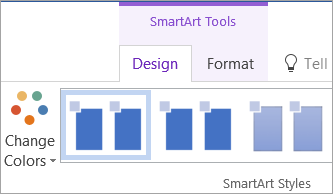
If you don't see the SmartArt Tools or Design tabs, make sure that you've selected a SmartArt graphic.
-
Click the color combination that you want.
Tip: When you place your pointer over a thumbnail, you can see how the colors affect your SmartArt graphic.
-
Right-click the border of a box, and then click Format Shape on the shortcut menu.
-
Under Fill, click Solid fill.
-
Click Color, and then click the color that you want.
-
To specify how much you can see through the background color, move the Transparency slider, or enter a number in the box next to the slider. You can vary the percentage of transparency from 0% (fully opaque, the default setting) to 100% (fully transparent).
A SmartArt Style is a combination of various effects, such as line style, bevel, or 3-D, that you can apply to the boxes in your SmartArt graphic to create a unique and professionally designed look.
-
Click the SmartArt graphic whose SmartArt Style you want to change.
-
Under SmartArt Tools, on the Design tab, in the SmartArt Styles group, click the SmartArt Style that you want.
To see more SmartArt Styles, click the More button
If you don't see the SmartArt Tools or Design tabs, make sure that you've selected a SmartArt graphic.

Tip: For even more effect options, such as shadow, glow, and reflection, under SmartArt Tools, on the Format tab, in the Shape Styles group, click Shape Effects, and then choose the effect that you want.
See Also
Create an organization chart (video)


