
By default, data that is hidden in rows and columns in the worksheet is not displayed in a chart, and empty cells or null values are displayed as gaps. For most chart types, you can display the hidden data in a chart.
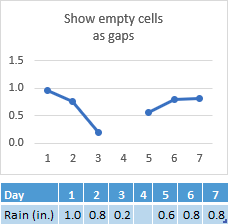
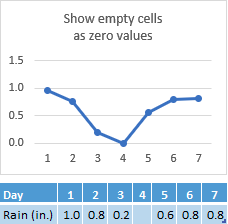
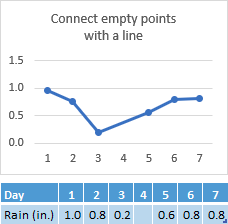
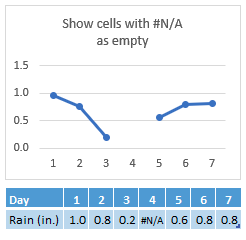
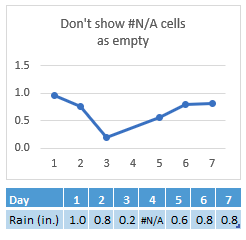
For line, scatter, and radar chart types, you can also change the way that empty cells, and cells that display the #N/A error are displayed in the chart. Instead of displaying empty cells as gaps, you can display empty cells as zero values (0), or you can span the gaps with a line. For #N/A values, you can choose to display those as an empty cell or connect data points with a line. The following examples show Excel’s behavior with each of these options.
Options for showing empty cells
Options for cells with #N/A
Change the way that empty cells, null (#N/A) values, and hidden rows and columns are displayed in a chart
-
Click the chart you want to change.
-
Go to Chart Tools on the Ribbon, then on the Design tab, in the Data group, click Select Data.
-
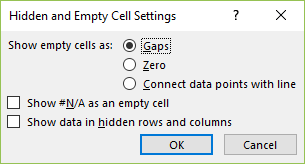
Click Hidden and Empty Cells.
-
In the Show empty cells as: options box, click Gaps, Zero, or Connect data points with line.
Note: On a scatter chart that displays only markers (without connecting lines), you can display empty cells as gaps or zero only — you cannot connect the data points with a line.
-
Click the Show #N/A as an empty cell option if you don’t want Excel to plot those points.

Notes:
-
This feature is only available if you have a Microsoft 365 subscription and is currently only available to Insiders. If you are a Microsoft 365 subscriber, make sure you have the latest version of Office.
Buy or try Microsoft 365 -
In order to maintain backwards compatibility with other versions of Excel, this feature is off by default.
-
-
Click the Show data in hidden rows and columns option if you want Excel to plot hidden data.
Need more help?
You can always ask an expert in the Excel Tech Community, get support in the Answers community, or suggest a new feature or improvement. see How do I give feedback on Microsoft Office? to learn how to share your thoughts. We're listening.


