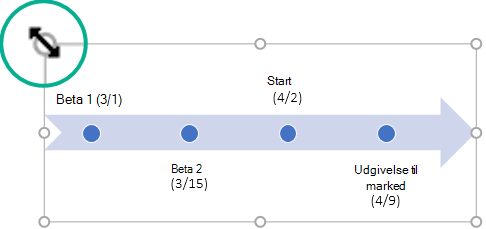
Brug enSmartArt-grafik til at oprette en tidslinje, der viser måldatoer for en opgave eller et projekt.
Opret en tidslinje
-
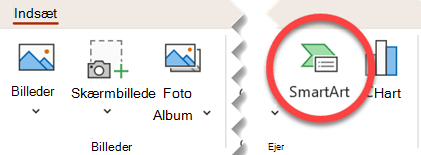
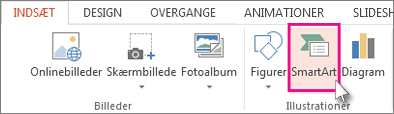
Klik på SmartArt under fanen Indsæt.
-
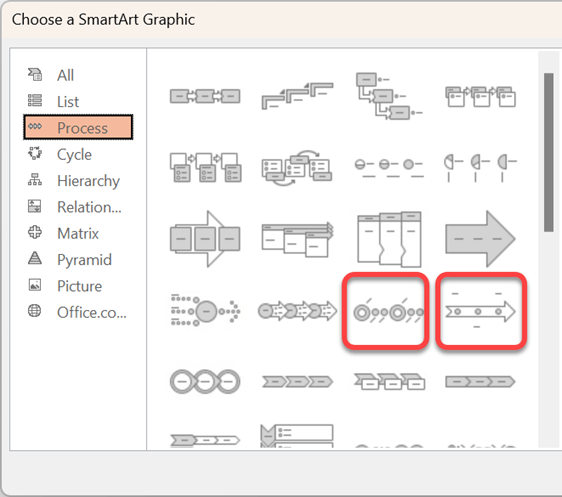
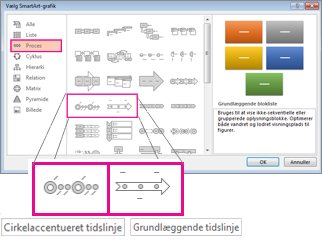
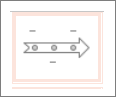
In the Choose a SmartArt Graphic gallery, click Process, and then double-click a timeline layout.
Tip!: There are two timeline SmartArt graphics: Basic timeline and Circle Accent Timeline, but you can also use almost any process-related SmartArt graphic.
-
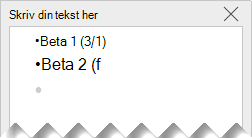
Click [Text], and then type or paste your text in the SmartArt graphic.
Bemærk!: You can also open the Text Pane and type your text there. If you do not see the Text Pane, on the SmartArt ToolsDesign tab, click Text Pane.
Add more dates to your timeline
-
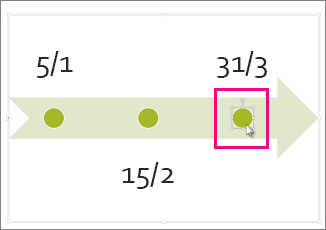
Klik på en figur på tidslinjen.
-
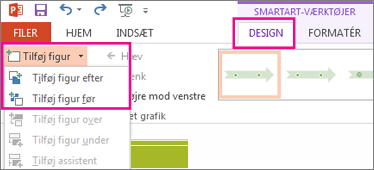
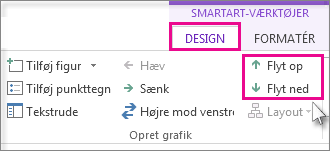
Gør et af følgende under fanen SmartArt-design:
-
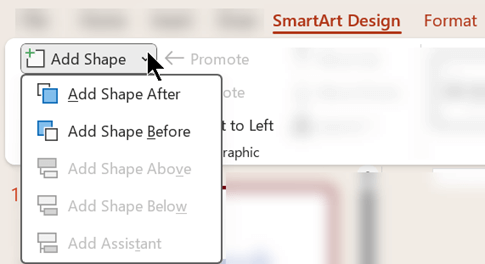
To add an earlier date, click Add Shape, and then click Add Shape Before.
-
To add a later date, click Add Shape, and then click Add Shape After.
-
-
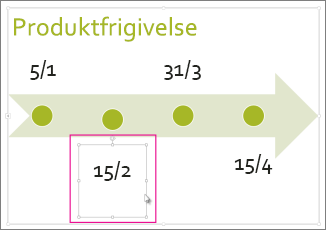
In the new date box, type the date that you want.
Move a date in your timeline
-
On the timeline, click the date you want to move.
-
Gør et af følgende under fanen SmartArt-design:
-
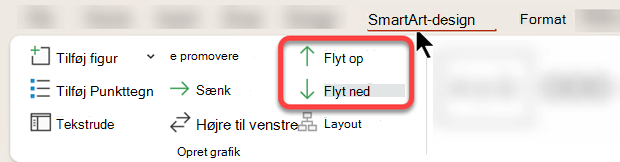
To move a date sooner than the selected date, click Move Up.
-
To move a date later than the selected date, click Move Down.
-
Skifte til et andet tidslinjelayout
-
Click the SmartArt graphic timeline.
-
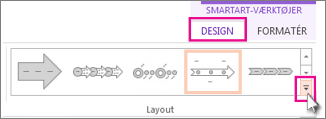
Klik på Flere i gruppen Layout under fanen SmartArt-design

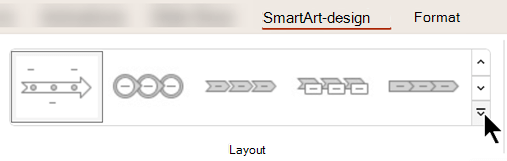
Bemærk!: To view only the timeline and process-related layouts, at the bottom of the layouts list, click More Layouts, and then click Process.
-
Vælg en tidslinje- eller procesrelateret SmartArt-grafik som f.eks. følgende:
-
Hvis du vil vise forløb på en tidslinje, skal du vælge Markeringsproces.
-
Klik Kontinuerlig billedliste for at oprette en tidslinje med billeder eller fotos. De runde former er designet til at indeholde billeder.
-
Ændre tidslinjens farver
-
Click the SmartArt graphic timeline.
-
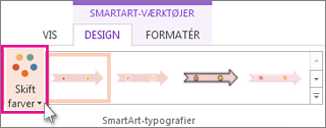
På fanen SmartArt-design skal du vælge Skift farver.
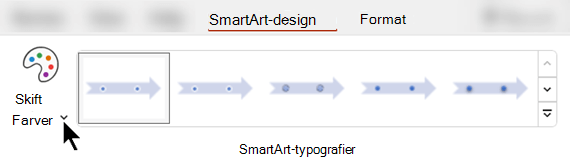
Bemærk!: If you don't see the SmartArt ToolsDesign tab, make sure you’ve selected the timeline.
-
Klik på den ønskede farvekombination.
Tip!: Place your pointer over any combination to see a preview of how the colors look in your timeline.
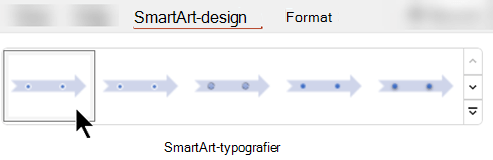
Anvende en SmartArt-typografi
A SmartArt style applies a combination of effects, such as line style, bevel, or 3-D perspective, in one click, to give your timeline a professionally polished look.
-
Klik på tidslinjen.
-
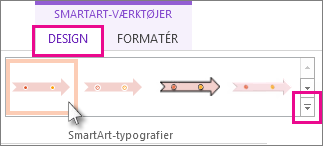
Klik på den ønskede typografi under fanen SmartArt-design.
Tip!: Hvis du vil have flere typografier, skal du klikke på Flere
Se også
Opret en tidslinje
-
Klik på SmartArt under fanen Indsæt.
-
In the Choose a SmartArt Graphic gallery, click Process, and then double-click a timeline layout.
Tip!: There are two timeline SmartArt graphics: Basic timeline and Circle Accent Timeline, but you can also use almost any process-related SmartArt graphic.
-
Click [Text], and then type or paste your text in the SmartArt graphic.
Bemærk!: You can also open the Text Pane and type your text there. If you do not see the Text Pane, on the SmartArt ToolsDesign tab, click Text Pane.
Add more dates to your timeline
-
Klik på en figur på tidslinjen.
-
On the SmartArt ToolsDesign tab, do one of the following:
-
To add an earlier date, click Add Shape, and then click Add Shape Before.
-
To add a later date, click Add Shape, and then click Add Shape After.
-
-
In the new date box, type the date that you want.
Move a date in your timeline
-
On the timeline, click the date you want to move.
-
On the SmartArt ToolsDesign tab, do one of the following:
-
To move a date sooner than the selected date, click Move Up.
-
To move a date later than the selected date, click Move Down.
-
Skifte til et andet tidslinjelayout
-
Click the SmartArt graphic timeline.
-
Klik på Flere
Bemærk!: To view only the timeline and process-related layouts, at the bottom of the layouts list, click More Layouts, and then click Process.
-
Vælg en tidslinje- eller procesrelateret SmartArt-grafik som f.eks. følgende:
-
Klik på Markeringsproces for at få vist fremskridt på tidslinjen.
-
Klik Kontinuerlig billedliste for at oprette en tidslinje med billeder eller fotos. De runde former er designet til at indeholde billeder.
-
Ændre tidslinjens farver
-
Click the SmartArt graphic timeline.
-
On the SmartArt ToolsDesign tab, click Change Colors.
Bemærk!: If you don't see the SmartArt ToolsDesign tab, make sure you’ve selected the timeline.
-
Klik på den ønskede farvekombination.
Tip!: Place your pointer over any combination to see a preview of how the colors look in your timeline.
Anvende en SmartArt-typografi
A SmartArt style applies a combination of effects, such as line style, bevel, or 3-D perspective, in one click, to give your timeline a professionally polished look.
-
Klik på tidslinjen.
-
On the SmartArt ToolsDesign tab, click the style you want.
Tip!: Hvis du vil have flere typografier, skal du klikke på Flere
Se også
Opret en tidslinje
-
Klik på SmartArt under fanen Indsæt.
-
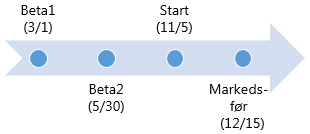
Vælg et tidslinjelayout i det galleri, der vises, f.eks. denne Grundlæggende tidslinje i sektionen Liste .
På sliden åbnes et tekstredigeringsprogram ud for grafikken, så du nemt kan føje ord til grafikken.
-
Angiv datoer og beskrivelser i teksteditoren, og tryk derefter på Enter.
-
Du kan også vælge at oprette et underelement i punktopstillingen ved at klikke på punkttegnet med den tekst, du vil bruge til et underelement, og klikke på Sænk under fanen SmartArt.
Ændre en tidslinjes farve eller typografi
Du kan ændre farven eller typografien for tidslinjegrafikken. Du kan også vælge et andet grafisk layout helt.
-
Vælg tidslinjen.
-
Vælg fanen SmartArt på båndet, og vælg derefter enten Skift farver eller Typografier for at få vist en menu med tilgængelige indstillinger for tidslinjegrafikken. Klik på den typografi eller farve, du vil markere.
-
Du kan også prøve at ændre layoutet ved at åbne layoutgalleriet til venstre for Skift farver. Nogle af indstillingerne i liste- ogprocessektionerne i galleriet egner sig til tidslinjer.
Tilpas størrelsen på tidslinjen
Du kan ændre størrelsen på grafikken, så den passer bedre på din slide.
-
Vælg tidslinjen.
-
Peg på et af størrelseshåndtagene i hjørnet, indtil du ser den tohovedet pil, og klik og træk derefter for at ændre tidslinjens størrelse.