Pierakstīties, izmantojot Microsoft
Pierakstīties vai izveidot kontu
Sveicināti!
Atlasīt citu kontu.
Jums ir vairāki konti
Izvēlieties kontu, ar kuru vēlaties pierakstīties.
angļu
Diemžēl šis raksts jūsu valodā nav pieejams.

Tracking progress can seem complicated but here’s a quick way to show percent complete using progress bar on a Gantt chart.

Tip:  If you’d like help with creating a Gantt chart, see Use a wizard to create a Gantt chart.

  1. On the Gantt chart, click a task and click Task and the percentage complete you want to show.
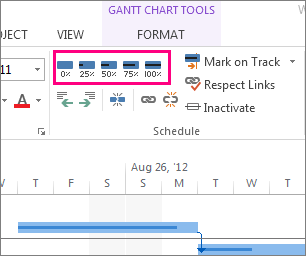
    task complete bars on the format tab

    For example, to show a task as 25 completed, click Task > 25% Complete.

  2. To see the task progress, point to the dark line inside the bar.

the percentage of task completed seen on the bar

If you want show more than the percent complete for tasks, you might want to learn about tracking linked critical tasks or using highlight to show linked tasks.

For tracking progress of schedules, take a look at how Project schedules tasks behind the scenes.

See also

Update completed tasks quickly

Nepieciešama papildu palīdzība?

Vēlaties vairāk opciju?

Explore subscription benefits, browse training courses, learn how to secure your device, and more.

Communities help you ask and answer questions, give feedback, and hear from experts with rich knowledge.

Vai šī informācija bija noderīga?

Kas ietekmēja jūsu pieredzi?
Nospiežot Iesniegt, jūsu atsauksmes tiks izmantotas Microsoft produktu un pakalpojumu uzlabošanai. Jūsu IT administrators varēs vākt šos datus. Paziņojums par konfidencialitāti.

Paldies par jūsu atsauksmēm!

×