Prisijunkite prie „Microsoft“
Prisijunkite arba sukurkite paskyrą.
Sveiki,
Pasirinkti kitą paskyrą.
Turite kelias paskyras
Pasirinkite paskyrą, kurią naudodami norite prisijungti.
Anglų
Atsiprašome, tačiau šis straipsnis neprieinamas jūsų kalba.

Tracking progress can seem complicated but here’s a quick way to show percent complete using progress bar on a Gantt chart.

Tip:  If you’d like help with creating a Gantt chart, see Use a wizard to create a Gantt chart.

  1. On the Gantt chart, click a task and click Task and the percentage complete you want to show.

    task complete bars on the format tab

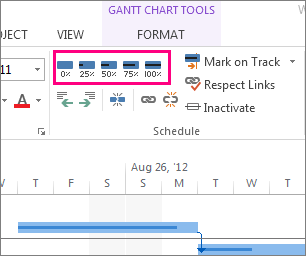
    For example, to show a task as 25 completed, click Task > 25% Complete.

  2. To see the task progress, point to the dark line inside the bar.

the percentage of task completed seen on the bar

If you want show more than the percent complete for tasks, you might want to learn about tracking linked critical tasks or using highlight to show linked tasks.

For tracking progress of schedules, take a look at how Project schedules tasks behind the scenes.

See also

Update completed tasks quickly

Reikia daugiau pagalbos?

Norite daugiau parinkčių?

Explore subscription benefits, browse training courses, learn how to secure your device, and more.

Communities help you ask and answer questions, give feedback, and hear from experts with rich knowledge.

Ar ši informacija buvo naudinga?

Kas turėjo įtakos jūsų įspūdžiams?
Paspaudus mygtuką Pateikti, jūsų atsiliepimai bus naudojami tobulinant „Microsoft“ produktus ir paslaugas. Jūsų IT administratorius galės rinkti šiuos duomenis. Privatumo patvirtinimas.

Dėkojame už jūsų atsiliepimą!

×