
A Decomposition Tree is a PerformancePoint analytics tool that you can use to perform root-cause analysis by viewing how individual members in a group contribute to the whole. In a Decomposition Tree, members are ranked from greatest to least, or from least to greatest. The Decomposition Tree enables users to decompose, or break down, a group to see its individual members and how they can be ranked according to a selected measure, such as by sales amounts.
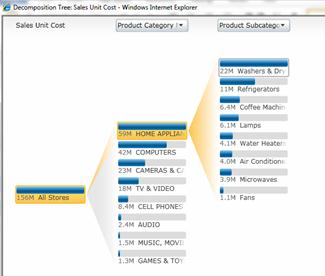
A Decomposition Tree might resemble the following image:
In this article
How do I create or open a Decomposition Tree?
Dashboard authors do not create the Decomposition Tree by using PerformancePoint Dashboard Designer. In addition, you do not see a Decomposition Tree as a top-level view that is always displayed in a dashboard alongside other views. Instead, you open the Decomposition Tree from a view in a dashboard that has been deployed to Microsoft SharePoint Server 2010.
Note: In order to open and use the Decomposition Tree, you must have Microsoft Silverlight 3 installed on your computer. Also note that depending on how a scorecard or an analytic view is configured, you might not be able to open the Decomposition Tree.
To open the Decomposition Tree, use the following procedure:
-
In the dashboard, select a view that uses SQL Server Analysis Services data. Examples include analytic charts and grids, and some kinds of scorecards.
-
Right-click on a value in the view, and then select Decomposition Tree. The value can be a cell in a scorecard or a grid, or it can be an amount in a chart. The Decomposition Tree opens in a browser window.
How do I use a Decomposition Tree?
You would typically use a Decomposition Tree to see how an individual value in a report or a scorecard can be broken down into its contributing members. The Decomposition Tree automatically sorts results and applies an inline Pareto chart to the data, so you can quickly see the highest contributors to a particular report value. You can also see trends across individual members that contribute to an overall value.
Using the Decomposition Tree, you can also view member properties for a particular dimension member, as shown in the following image:

When you use the Decomposition Tree, you typically start with one bar, which is a decomposition node, located on the left side of the screen. Use the following procedure to conduct root-cause analysis:
-
Click a decomposition node. A list of dimensions and hierarchies displays.
-
Select the dimension and hierarchy that you want to use. The view automatically refreshes to display the next level of detail for the item that you selected.
-
Repeat Steps 1 and 2 to continue drilling to detail in the view.
-
To view member properties for a dimension member, browse to an individual dimension member. Click its node to open a dialog box that contains additional options. Click Show Properties.


