
Each SmartArt layout provides a different way to express your content and enhance your message. Some layouts simply add visual polish to a bulleted list, and other layouts (such as organization charts and Venn diagrams) are designed to portray specific kinds of information.
Tip: Click the following headings for more information about each topic.
Before you choose a layout for your SmartArt graphic, ask yourself what you want to convey and whether you want your information to appear a certain way. Since you can quickly and easily switch layouts, try different layouts (across types) until you find the one that best illustrates your message. A type is similar to a category that can help you quickly choose the appropriate layout for your information. Experiment with different types. The table below is not an exhaustive list, but can help you as a starting point.
|
To do this |
Use this type |
|---|---|
|
Show nonsequential information. |
List |
|
Show steps in a process or timeline; create a flow chart. |
Process |
|
Show a continual process. |
Cycle |
|
Create an organization chart. |
Hierarchy |
|
Show a decision tree. |
Hierarchy |
|
Illustrate connections. |
Relationship |
|
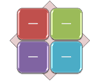
Show how parts relate to a whole. |
Matrix |
|
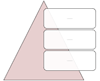
Show proportional relationships with the largest component on the top or bottom. |
Pyramid |
|
Use pictures prominently to convey or accent content. |
Picture |
Also consider the amount of text that you have, because the amount of text affects the look and the number of shapes that you need in a layout. Are there several main points with subpoints underneath them? Do the details carry more weight than the summary points, or vice versa? In general, SmartArt graphics are most effective when the number of shapes and the amount of text are limited to key points. Larger amounts of text can distract from the visual appeal of your SmartArt graphic and make it harder to convey your message visually. However, some layouts, such as the Trapezoid List layout in the List type, work well with larger amounts of text.
For each type of SmartArt graphic, many unique layouts are available. Some have picture placeholders. Some layouts are made up of separate shapes for each item of information, including subpoints. Other layouts combine subpoints with their summary points. Looking at the positioning of the summary information in relation to the details helps you get a sense of which pieces of information will draw the most attention from your audience. Make sure that the most important data is in the position of greatest attention.
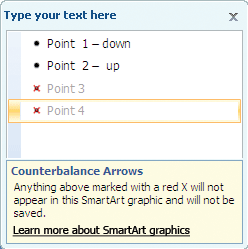
Some layouts for SmartArt graphics contain a limited number of shapes. For example, the Counterbalance Arrows layout in the Relationship type is designed to show two opposing ideas or concepts. Only two shapes can contain text, and the layout cannot be changed to display more ideas or concepts. If you choose a layout with a limited number of shapes, you can tell what content will not appear in your SmartArt graphic because a red X (rather than a bullet point) will appear next to these items in the Text pane.
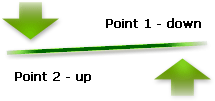
If you need to convey more than two ideas, switch to another SmartArt graphic layout that has more than two shapes for text, such as the Basic Pyramid layout in the Pyramid type. Keep in mind that changing layouts or types can alter the meaning of your information. For example, a layout with arrows pointing to the right, such as Basic Process in the Process type, has a different meaning from a SmartArt graphic with arrows going in a circle, such as Continuous Cycle in the Cycle type.
When you switch to a different SmartArt graphic layout, most of your text and other content, colors, styles, effects, and text formatting are automatically carried over to the new layout.
Or you can reevaluate your content to see if any of the information is less vital to your message. SmartArt graphics with fewer concepts and fewer words are often most effective.
If you cannot find the exact layout that you want, you can add and remove shapes in your SmartArt graphic to adjust the structure of the layout. For example, the Basic Process layout in the Process type appears with three shapes, but your process may need only two shapes, or it may need five shapes. As you add or remove shapes and edit your text, the arrangement of the shapes and the amount of text within those shapes is updated automatically — maintaining the original design and border of the layout for your SmartArt graphic.
When you select a new layout, placeholder text (such as [Text]) appears. Placeholder text is not printed and does not appear during a PowerPoint presentation. You can replace the placeholder text with your own content. If you switch layouts with placeholder text appearing, you will see the placeholder text in the new layout. Note that the shapes always appear and are printed unless you delete them.
Also, consider the size of the space where you will place the SmartArt graphic. For example, if you have a tall, skinny space, choose a vertical layout like Staggered Process in the Process type, rather than a horizontal layout like Process Arrows in the Process type.
Some layouts have a fixed aspect ratio, so they might not take up the entire space. Aspect ratio refers to the ratio between width and height. For example, if you place the Grid Matrix layout in the Matrix type into a space that is wider than it is tall, the SmartArt graphic will not use all of the width blank space. To change the aspect ratio, you can change the layout of your slide or document, change the size of the space where you are placing the SmartArt graphic (thereby changing the look of the SmartArt graphic), or switch to a different SmartArt graphic layout with a different aspect ratio.
The Choose a SmartArt Graphic gallery displays all available layouts broken into eleven different types — All, List, Process, Cycle, Hierarchy, Relationship, Matrix, Pyramid, Picture, Office.com, and Other. (The Office.com type shows additional layouts available on Office.com. The Other type appears only if you add custom SmartArt graphics and do not add them to one of the other types.) Descriptions that suggest what type of information is appropriate for a given layout appear under the larger image to one side of the Choose a SmartArt Graphic gallery.
Select a layout
All available layouts for SmartArt graphics appear in the All type.
When you choose a layout, keep the following in mind:
-
Layouts that contain arrows imply flow or progression in a certain direction.
-
Layouts that contain connecting lines instead of arrows imply connections, but not necessarily flow or progression.
-
Layouts that do not contain connecting lines or arrows show a collection of objects or ideas with no strong relationship to one another.
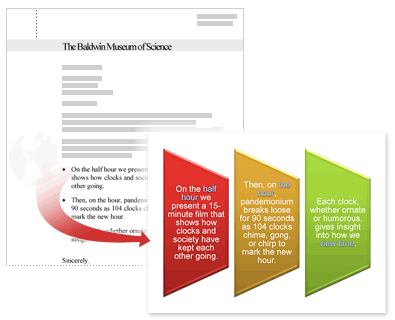
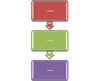
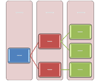
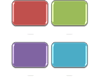
If you want bulleted text to stand out, you can easily transfer text to shapes that you can color, give dimension to, and emphasize with visual effects or animation. By using a layout in the List type, your main points gain visibility and impact in colorful shapes that emphasize their importance. List layouts group information that does not follow a step-by-step or sequential process. Unlike Process layouts, List layouts usually do not have arrows or a directional flow.
As the example below illustrates, a bulleted list can be much more dramatic when you convert it to a SmartArt graphic.
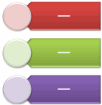
Some List layouts include picture shapes so that you can accent your text with a small picture or drawing. Although picture placeholder shapes are designed to display pictures, you can add a picture as fill to any shape.
Tip: Instead of putting large amounts of text into a SmartArt graphic, put only the main points into the SmartArt graphic, and then have another slide or document that expounds on your main points.
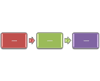
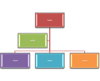
Unlike List layouts, layouts in the Process type usually have a directional flow and are used to illustrate steps or stages in a process or workflow, such as sequential steps for completing a task, general phases in the development of a product, or a timeline or schedule. Use Process layouts when you want to show how steps or phases follow one another to produce a result. Process layouts are available showing a process in vertical steps, horizontal steps, or a bending combination.
You can also use Process layouts to show major dates in a production schedule or a timeline with milestone markers.

Another layout that works well for showing dates or numbered steps is the Process Arrows layout. You can place numbers or dates in the primary shapes (circles) and text for the steps in the accompanying arrow shapes.
Note: To create a flow chart, use a layout such as Vertical Bending Process, and then substitute different shapes for the flow chart shapes.

Although you can use a Process layout to communicate step-by-step information, a layout in the Cycle type usually illustrates a circular or repetitive process. You can use Cycle layouts to show product or animal life cycles, teaching cycles, repeated or ongoing processes (such as a continuous writing and publishing cycle for a Web site), or an employee's annual goal-setting and performance review cycle.
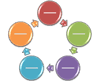
Learn more: Cycle type SmartArt graphic descriptions
Perhaps the most common usage for layouts in the Hierarchy type is a company organization chart. But Hierarchy layouts can also be used to show decision trees, family trees, or a family of products.
Note: If you want to create an organization chart, use the Organization Chart layout, the Name and Title Organization layout, or Picture Organization Chart layout. When you use these layouts, additional functionality, such as the assistant shape and the hanging layouts, becomes available. You can learn more about creating organization charts by reading Create an organization chart.

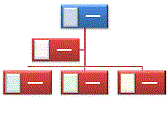
Learn more: Hierarchy type SmartArt graphic descriptions
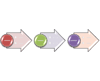
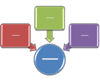
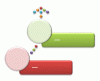
Layouts in the Relationship type show nonprogressive, nonhierarchical relationships between parts (such as interlocking or overlapping concepts) and typically depict conceptual relationships or connections between two or more sets of things. Good examples of Relationship layouts are Venn diagrams, which show how areas or concepts overlap and come together at a center intersection; target layouts, which show containment; and radial layouts, which show relationships to a central core or concept. You can learn more about creating Venn diagrams by reading Create a Venn diagram.

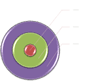
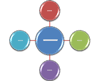
Radial layouts can also be used to show parts coming together to form one main or central idea.
Learn more: Relationship type SmartArt graphic descriptions
Layouts in the Matrix type usually classify information and are two-dimensional. They are used to show the relationship of parts to a whole or to a central concept. Matrix layouts are a good choice if you have four or fewer key points and large amounts of text.
Learn more: Matrix type SmartArt graphic descriptions
Layouts in the Pyramid type show proportional or hierarchical relationships that typically build upward. They work best with information that you want to show from top to bottom or from bottom up. If you want to show a horizontal hierarchy, you should choose a Hierarchy layout.
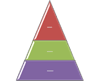
You can also use Pyramid layouts to convey conceptual information, such as the Pyramid List layout that allows you to type text in shapes outside of the pyramid.
Learn more: Pyramid type SmartArt graphic descriptions
Layouts in the Picture type are used when you want a picture to convey your message with or without explanatory text or you want to use pictures to complement a list or process.
Learn more: Picture type SmartArt graphic descriptions
Additional layouts available from Office.com are shown in the Office.com type. This type will be periodically updated with new layouts.
Learn more: Office.com type SmartArt graphic descriptions
This type can be used for custom SmartArt graphics that do not fit into any of the types described above.
After you've chosen the SmartArt graphic that's right for you, you can edit and customize it to further meet your needs. See the following articles to learn more about working with the SmartArt graphics that you create:


