
Returns covariance, the average of the products of deviations for each data point pair in two data sets.
Use covariance to determine the relationship between two data sets. For example, you can examine whether greater income accompanies greater levels of education.
Important: This function has been replaced with one or more new functions that may provide improved accuracy and whose names better reflect their usage. Although this function is still available for backward compatibility, you should consider using the new functions from now on, because this function may not be available in future versions of Excel.
For more information about the new functions, see COVARIANCE.P function and COVARIANCE.S function.
Syntax
COVAR(array1,array2)
The COVAR function syntax has the following arguments:
-
Array1 Required. The first cell range of integers.
-
Array2 Required. The second cell range of integers.
Remarks
-
The arguments must either be numbers or be names, arrays, or references that contain numbers.
-
If an array or reference argument contains text, logical values, or empty cells, those values are ignored; however, cells with the value zero are included.
-
If array1 and array2 have different numbers of data points, COVAR returns the #N/A error value.
-
If either array1 or array2 is empty, COVAR returns the #DIV/0! error value.
-
The covariance is:
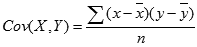
where

are the sample means AVERAGE(array1) and AVERAGE(array2), and n is the sample size.
Example
Copy the example data in the following table, and paste it in cell A1 of a new Excel worksheet. For formulas to show results, select them, press F2, and then press Enter. If you need to, you can adjust the column widths to see all the data.
|
Data1 |
Data2 |
|
|
3 |
9 |
|
|
2 |
7 |
|
|
4 |
12 |
|
|
5 |
15 |
|
|
6 |
17 |
|
|
Formula |
Description |
Result |
|
=COVAR(A2:A6, B2:B6) |
Covariance, the average of the products of deviations for each data point pair above. |
5.2 |


